Clustrex Data Private Limited

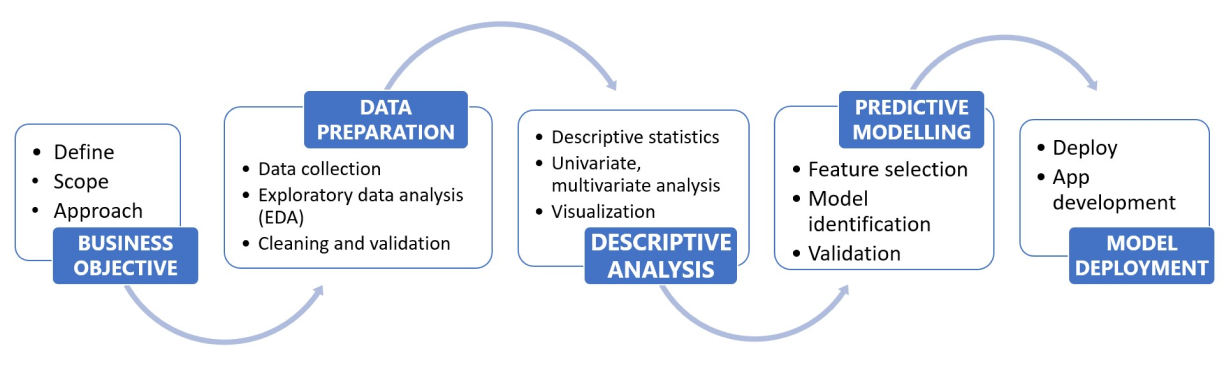
Data Analytics Stages

Data Analytic Stage

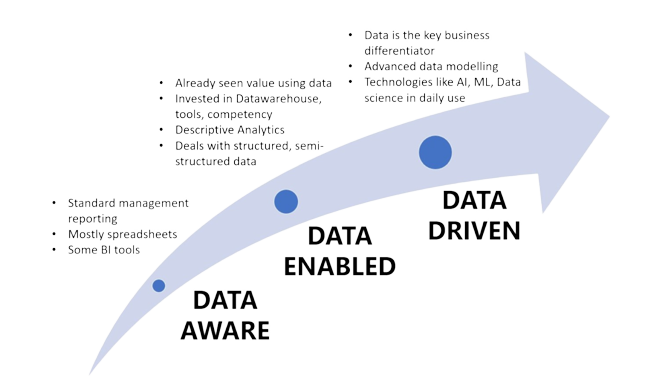
Data Maturity in Organizations

Clustrex collaborates with organization across a variety of domain to move them upto the highest levels of maturity in their data journey where DATA is the key business differentiator.

Data Analytic Stage

Our Services

Extracting insights from data and enabling, Data-driven Decisions, Healthcare, Energy, Education, and Transportation.

Data Ingestion

Onboarding the data from various sources like API, XML, JSON, Databases, SpreadSheets, CSV, Webpages, and more.

Technology: AWS Lambda, Glue, EMR, Nifi, Python, Apache Spark, HDFS, ETL Talend

Data Preparation

Cleaning, Parsing, Structuring, Deduplication, Enrichment, Validation.

Technology: Python, Pandas, Numpy

Data Warehouse

Build large scale data warehouses that support analytics tools, dashboard by storing data efficiently, delivering results to many concurrent users.

Technology: PostgreSQL, AWS RDS

Data Governance

Helps in having common data definitions, avoiding data silos and inconsistencies, improving data quality, enforcing policies to prevent misuse and errors, ensuring regulatory compliance.

Technology: Data Dictionary, Policy Management and Access control, Audit logs

Data Visualization

In the Big Data world, data visualization tools are key to analyze large scale information and implement data-driven decisions. Visualization uncovers trends, patterns and outlier in data.

Technology: Tableau, AWS QuickSight, D3.js

Data Extraction

Extraction of meaningful information from semi structured data, and images is key to many industries and domains. User our data extraction as a service to pull information and drive workflows or deliver insights.

Data Deduplication

Deduplication is a process of identifying and eliminating redundant data from a dataset. Redundant data is becoming a critical issue for organizations across domains such as healthcare, finance, retail, education, and almost anywhere else.

Case Study

Vector-1

1. Education Analytics Application

  • arrow-icon

    Objective :

    Develop a comprehensive analytics platform to empower mentors with actionable insights on student performance, attendance, and learning progress.
  • arrow-icon

    Scope :

    Deliver intuitive visualization charts, comprehensive performance reports, and an integrated data analysis ecosystem to enhance educational outcomes.
  • arrow-icon

    Key Features:

    • Visualization of student attendance, test scores, and learning progress.
    • Customizable performance report generation for individual students.
    • ETL processes for data extraction, transformation, and loading from multiple applications.
    • Evaluation tools to assess both student and mentor effectiveness.
  • arrow-icon

    Technologies Used:

    • Frontend:

      D3.js – for dynamic and interactive data visualization charts.
    • Backend:

      Python – for data processing and application logic.
    • Cloud Infrastructure:

      • AWS Lambda – for serverless compute and efficient event-driven processing.
      • Amazon ECS and EC2 – for scalable backend services and container orchestration.
      • Amazon RDS (PostgreSQL) – for robust and secure relational data storage.
  • arrow-icon

    Value Delivered:

    • Empowered Mentors: Equipped mentors with in-depth insights through intuitive dashboards, enabling timely interventions for students.
    • Data-Driven Decisions: Provided institutions with accurate data visualizations and reports to make informed decisions on educational strategies.
    • Improved Educational Quality: Facilitated a feedback loop by analyzing both student and mentor performance, driving continual improvements in teaching methods and learning outcomes.
    • Efficiency Through Automation: Automated ETL pipelines minimized manual data handling, ensuring data consistency, and reducing operational overhead.
  • arrow-icon

    Challenges Faced:

    • Data Integration Complexity: Consolidating data from multiple subsidiary applications required building robust ETL processes that could handle diverse data formats and inconsistencies.
    • Visualization Performance: Rendering large datasets in real-time visualizations without performance degradation was addressed through D3.js optimizations.
    • Scalability: Ensuring the application scaled efficiently with increasing data volume and user demand was mitigated using AWS services like ECS and Lambda.
    • User Adoption: Designing user-friendly interfaces and reports that met the needs of mentors with varying technical expertise demanded iterative UX improvements.
Vector-1

2. Point of Interest (PoI) Identification Using AI & Geospatial Data

  • arrow-icon

    Objective :

    Automate the identification and validation of Point of Interest (PoI) locations by integrating geospatial data, AI-powered image recognition, and automated data enrichment processes.
  • arrow-icon

    Scope :

    Deliver an end-to-end solution capable of analyzing large datasets, retrieving updated business and location information, and leveraging AI to accurately identify PoIs using satellite imagery.
  • arrow-icon

    Key Features:

    • Data extraction from various sources and regions for comprehensive coverage.
    • Automated retrieval of location details via the Google Search API.
    • Data validation and refinement by matching with Google Places data.
    • High-resolution satellite image acquisition for detailed analysis.
    • AI-powered PoI identification leveraging OpenAI’s image analysis capabilities.
    • Final verification and structuring of PoI datasets for downstream applications.
  • arrow-icon

    Technologies Used:

    • Programming Language:

      Python – for data processing, integration logic, and AI interfacing.
    • Database:

      PostgreSQL – for storing and managing large volumes of structured and geospatial data.
    • APIs and Services:

      • Google Search API – to retrieve business and location data.
      • Google Places API – for location validation and enrichment.
      • Google Satellite Image API – to obtain high-resolution imagery for analysis.
      • OpenAI API – for AI-driven image recognition and PoI identification.
    • Cloud Infrastructure:

      AWS – for scalable compute, storage, and deployment of the application components.
  • arrow-icon

    Value Delivered:

    • Automated PoI Discovery: Eliminated manual efforts in identifying Points of Interest by automating data extraction, validation, and AI-powered image analysis.
    • Enhanced Location Accuracy: Cross-referencing extracted data with real-time Google Places and Search APIs ensured high accuracy in location identification.
    • AI-Powered Insights: Leveraged advanced AI models to analyze satellite imagery, differentiating between PoIs and other structures, which increased the reliability of the results.
    • Scalability and Efficiency: Designed a scalable solution capable of handling large geographic regions and high data volumes with optimized ETL and AI processes.
    • Data-Driven Decision Making: Provided validated and structured PoI datasets that enhanced decision-making for applications in urban planning, logistics, and business expansion strategies.
  • arrow-icon

    Challenges Faced:

    • Data Consistency Across Sources: Integrating and reconciling data from multiple APIs and satellite images required robust validation mechanisms to ensure consistency and accuracy.
    • Image Analysis Precision: Achieving precise identification of PoIs from satellite imagery posed challenges in terms of AI model tuning and differentiation of similar structures.
    • Scalability of Processing Large Areas: Processing satellite data and AI analysis for expansive geographic areas demanded an optimized and scalable infrastructure, which was addressed using AWS services.
    • API Rate Limits and Costs: Managing API usage within rate limits and optimizing for cost-efficiency, especially for high-volume data retrieval from Google and OpenAI APIs.
Vector-1

3. Optimizing Revenue Cycle Management (RCM) in Healthcare

  • arrow-icon

    Objective :

    Streamline and optimize the Revenue Cycle Management process to enhance financial efficiency, reduce claim denials, and improve operational transparency for healthcare organizations.
  • arrow-icon

    Scope :

    Develop an integrated RCM solution that automates claims processing, ensures compliance, and provides actionable insights into financial operations.
  • arrow-icon

    Key Features:

    • Automated claims tracking and real-time reconciliation.
    • Proactive detection of underpayments and charge variances.
    • Accurate and automated fee schedule management.
    • Seamless integration with EMR and Practice Management Systems.
    • Interactive dashboards for lifecycle monitoring and revenue insights.
  • arrow-icon

    Technologies Used:

    • Healthcare Platforms:

      Athenahealth, Nextech – for seamless data integration with EMR and PMS systems.
    • Programming & Data Processing:

      Python – for custom logic, data pipelines, and automation scripts.
    • Data Warehousing & ETL:

      • Snowflake – for scalable data warehousing.
      • DBT, Dagster, Apache Airflow – for ETL orchestration and data transformation.
    • Databases:

      PostgreSQL – for structured data management.
    • Visualization & Reporting:

      Tableau, AWS QuickSight – for interactive dashboards and business intelligence reporting.
  • arrow-icon

    Value Delivered:

    • Enhanced Claims Processing & Transparency: Automated claim lifecycle management and custom dashboards improved accuracy, reduced administrative burden, and expedited reimbursement cycles.
    • Revenue Optimization & Compliance: Proactive monitoring of underpayments and charges ensured revenue integrity, while real-time reconciliation minimized financial discrepancies and enhanced compliance.
    • Accurate Fee Schedule Management: Automated fee schedule extraction and updates eliminated manual errors and maintained compliance with payer policies, reducing claim rejections due to outdated rates.
    • Reduced Claim Denials: Advanced coding validation and reconciliation processes increased first-pass acceptance rates, resulting in faster payments and fewer denials.
    • Seamless EMR/PMS Integration: Robust data pipelines enabled smooth interoperability between the RCM system and leading EMR platforms, facilitating end-to-end process automation.
    • Actionable Revenue Insights: Lifecycle monitoring dashboards and interactive visualizations provided transparency into key revenue metrics and enabled informed decision-making.
  • arrow-icon

    Challenges Faced:

    • Data Standardization: Integrating and standardizing disparate data sources from multiple EMR and PMS platforms required building robust ETL processes and reconciliation frameworks.
    • Complex Fee Schedule Management: Automating the extraction and update of payer fee schedules, each with varying formats and timelines, posed significant technical challenges.
    • Ensuring Data Integrity: Balancing automation with manual audits was necessary to ensure data accuracy, particularly in EOB audits and reimbursement tracking.
    • Scalability of ETL Pipelines: Handling large volumes of claim and billing data while maintaining high performance required the use of modern orchestration tools like Dagster and Airflow.
    • Regulatory Compliance: Maintaining compliance with healthcare regulations (HIPAA, payer-specific rules) while automating processes demanded stringent security and validation checks.
Hello

Say Hello!

Email

info@clustrex.com

Phone

044 4861 7210

Address
Madipakkam Office 1

No. 51/2 - II Floor, Pandian Complex, Madipakkam Main Road, Madipakkam, Chennai-600091

Madipakkam Office 2

A3, Anbu complex, near Ponniamman kovil street, Madipakkam, Chennai-600091

Request A Demo

Reach out to us and connect with our team to explore new possibilities.